CAP Data Displays
|
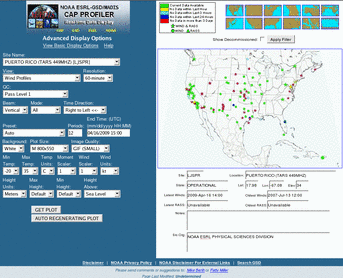
The real-time data display generates graphical (images).
Time-series displays include; Wind Speed and Direction, Spectral Moment
Displays (Signal Power, Signal to Noise Ratio, Radial Velocity,
and Velocity Variance), and RASS Temperature Displays.
The Advanced display options
allow user to customize display option for current and historical data, color scale,
units, height, time-span, background color, and image size and quality.
The maps indicating the location of profiler sites convey the status of
sites using color to indicate how recently data have been received from a site.
|
|
|
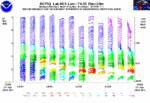
Wind Speed and Direction shown in vertical profiles.
The barbs point in the direction the wind is blowing towards. Color as well as the number
and length of the flags on each barb identify the wind speed. Each vertical
column represent either one hour, 30-minute, 15-minute, 10-minute, or 5-minute averaged data,
depending on the resolution (or sampling period) of the radar.
|
|
|
Signal to Noise Ratio
is a measure of the amount of the radar's energy
that has been reflected and returned from the atmosphere,
expressed in decibels (dB), values can range from 20 dB (very weak, blues)
to 100 dB (very strong, reds).
|
|
|
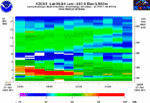
Signal Power is a measure of the amount of the radar's energy
that has been reflected and returned from the atmosphere. Signal Power is expressed
in decibels and values can range from 20 dB (very weak, blues) to 100 dB (very strong, reds). |
 |
|
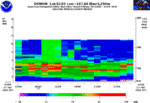
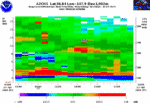
Range Corrected Signal to Noise Ratio and
for the spherical divergence of the transmitted radar signals as they propagate away
from the radar antenna.
Once the Signal to Noise Ratio is range corrected, it is
directly proportional to radar reflectivity, a more widely used radar variable.
|
|
|
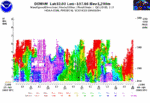
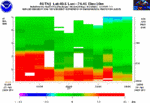
Radial Velocity is a measure of the amount of
Doppler Shift of the atmospheric signal returns expressed in meters per
second. Referenced to the frequency of the radar (404 MHz), incoming
signals cause positive Doppler shifts (> Tranmitted Frequency), outgoing signals
cause negative Doppler shifts (< Transmitted Frequency). Incoming signals are
colored shades of yellows and red, outgoing signals are colored shades
of cyan and blue.
|
|
|
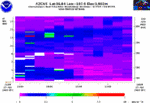
Velocity Variance is a measure of the spectral
width of atmospheric signal returns. Velocity Variance is expressed in
(meters/second)2. |
 |
|
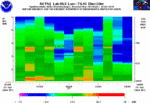
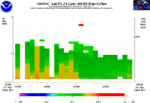
RASS Temperature is a vertical profile of
atmospheric temperatures at each range gate of the radar.
Colder temperatures are shades of blue, warm temperatures are shades of red. |
|
|
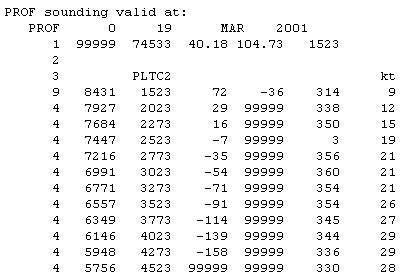
Text based data can be downloaded in FSL's standard
RAOB format. The dataset contains wind speed and direction, surface observations,
and RASS temperatures (where applicable). |
|
|
|
|